INTARC
The weekly profit check for app studios that buy users.
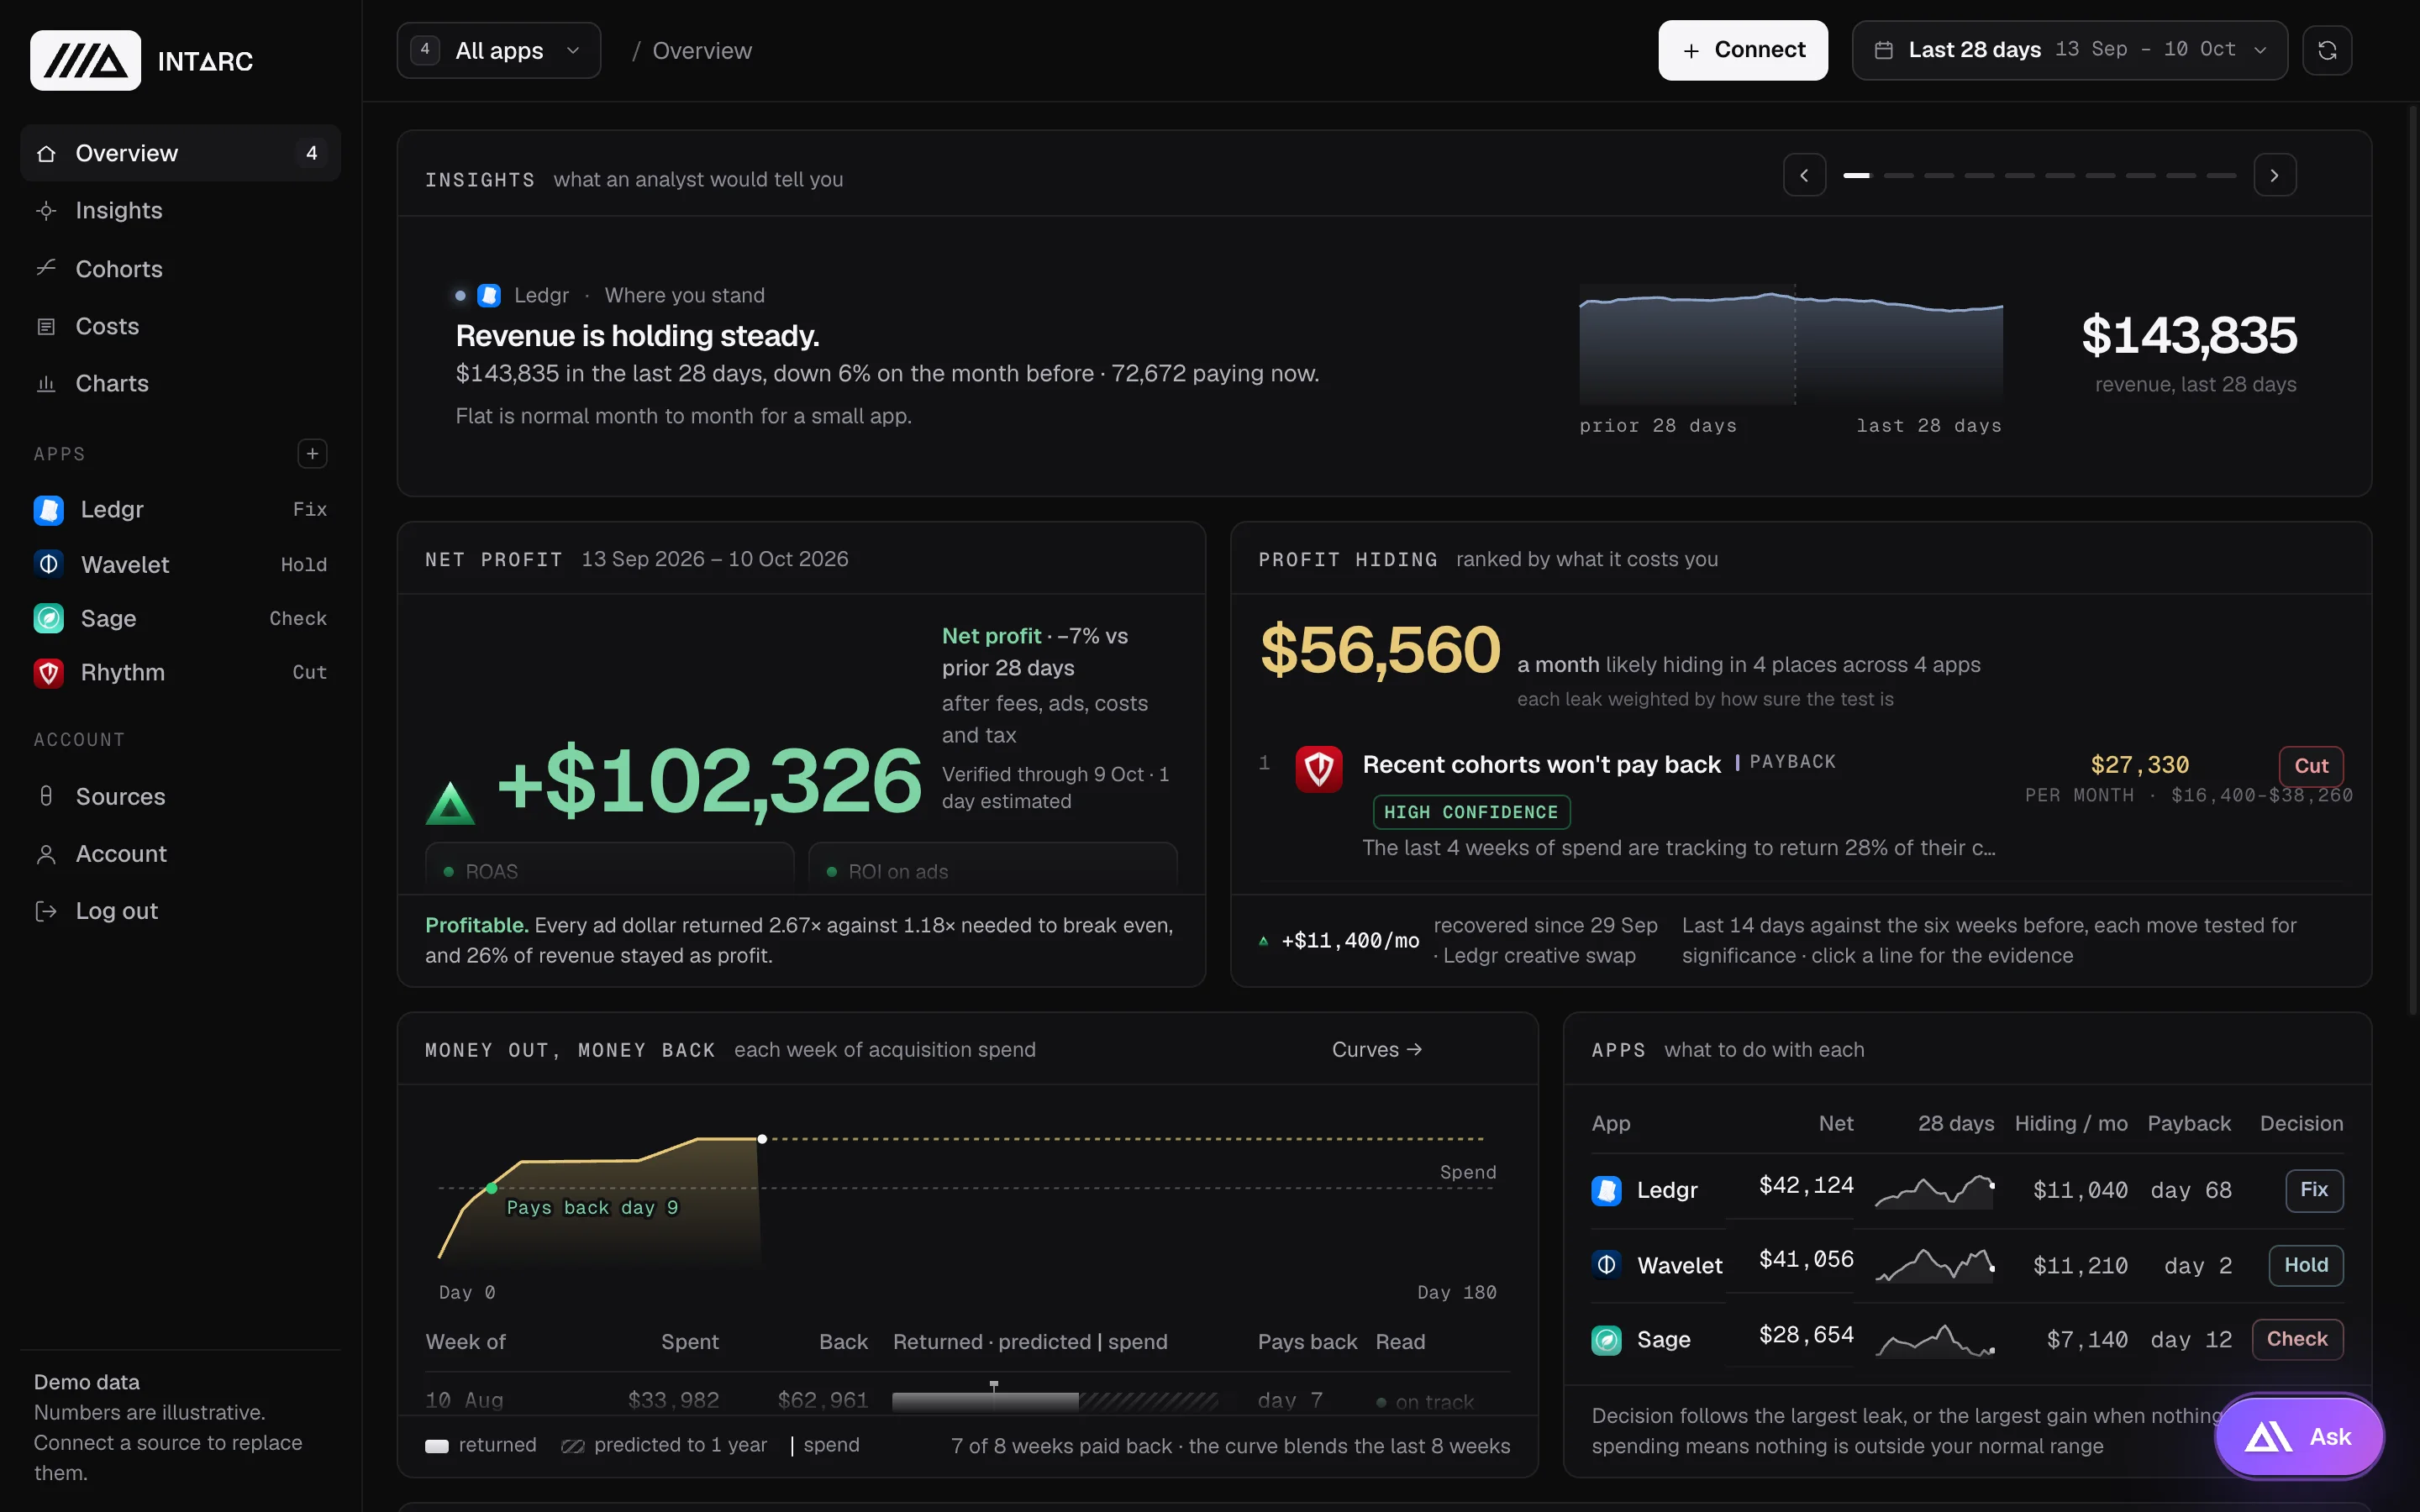
INTARC shows what each app really keeps after fees, ads, costs and tax, and flags the weeks of ad spend that won't pay back. From the tools you already use, with no SDK.
INTARC
INTARC shows what each app really keeps after fees, ads, costs and tax, and flags the weeks of ad spend that won't pay back. From the tools you already use, with no SDK.
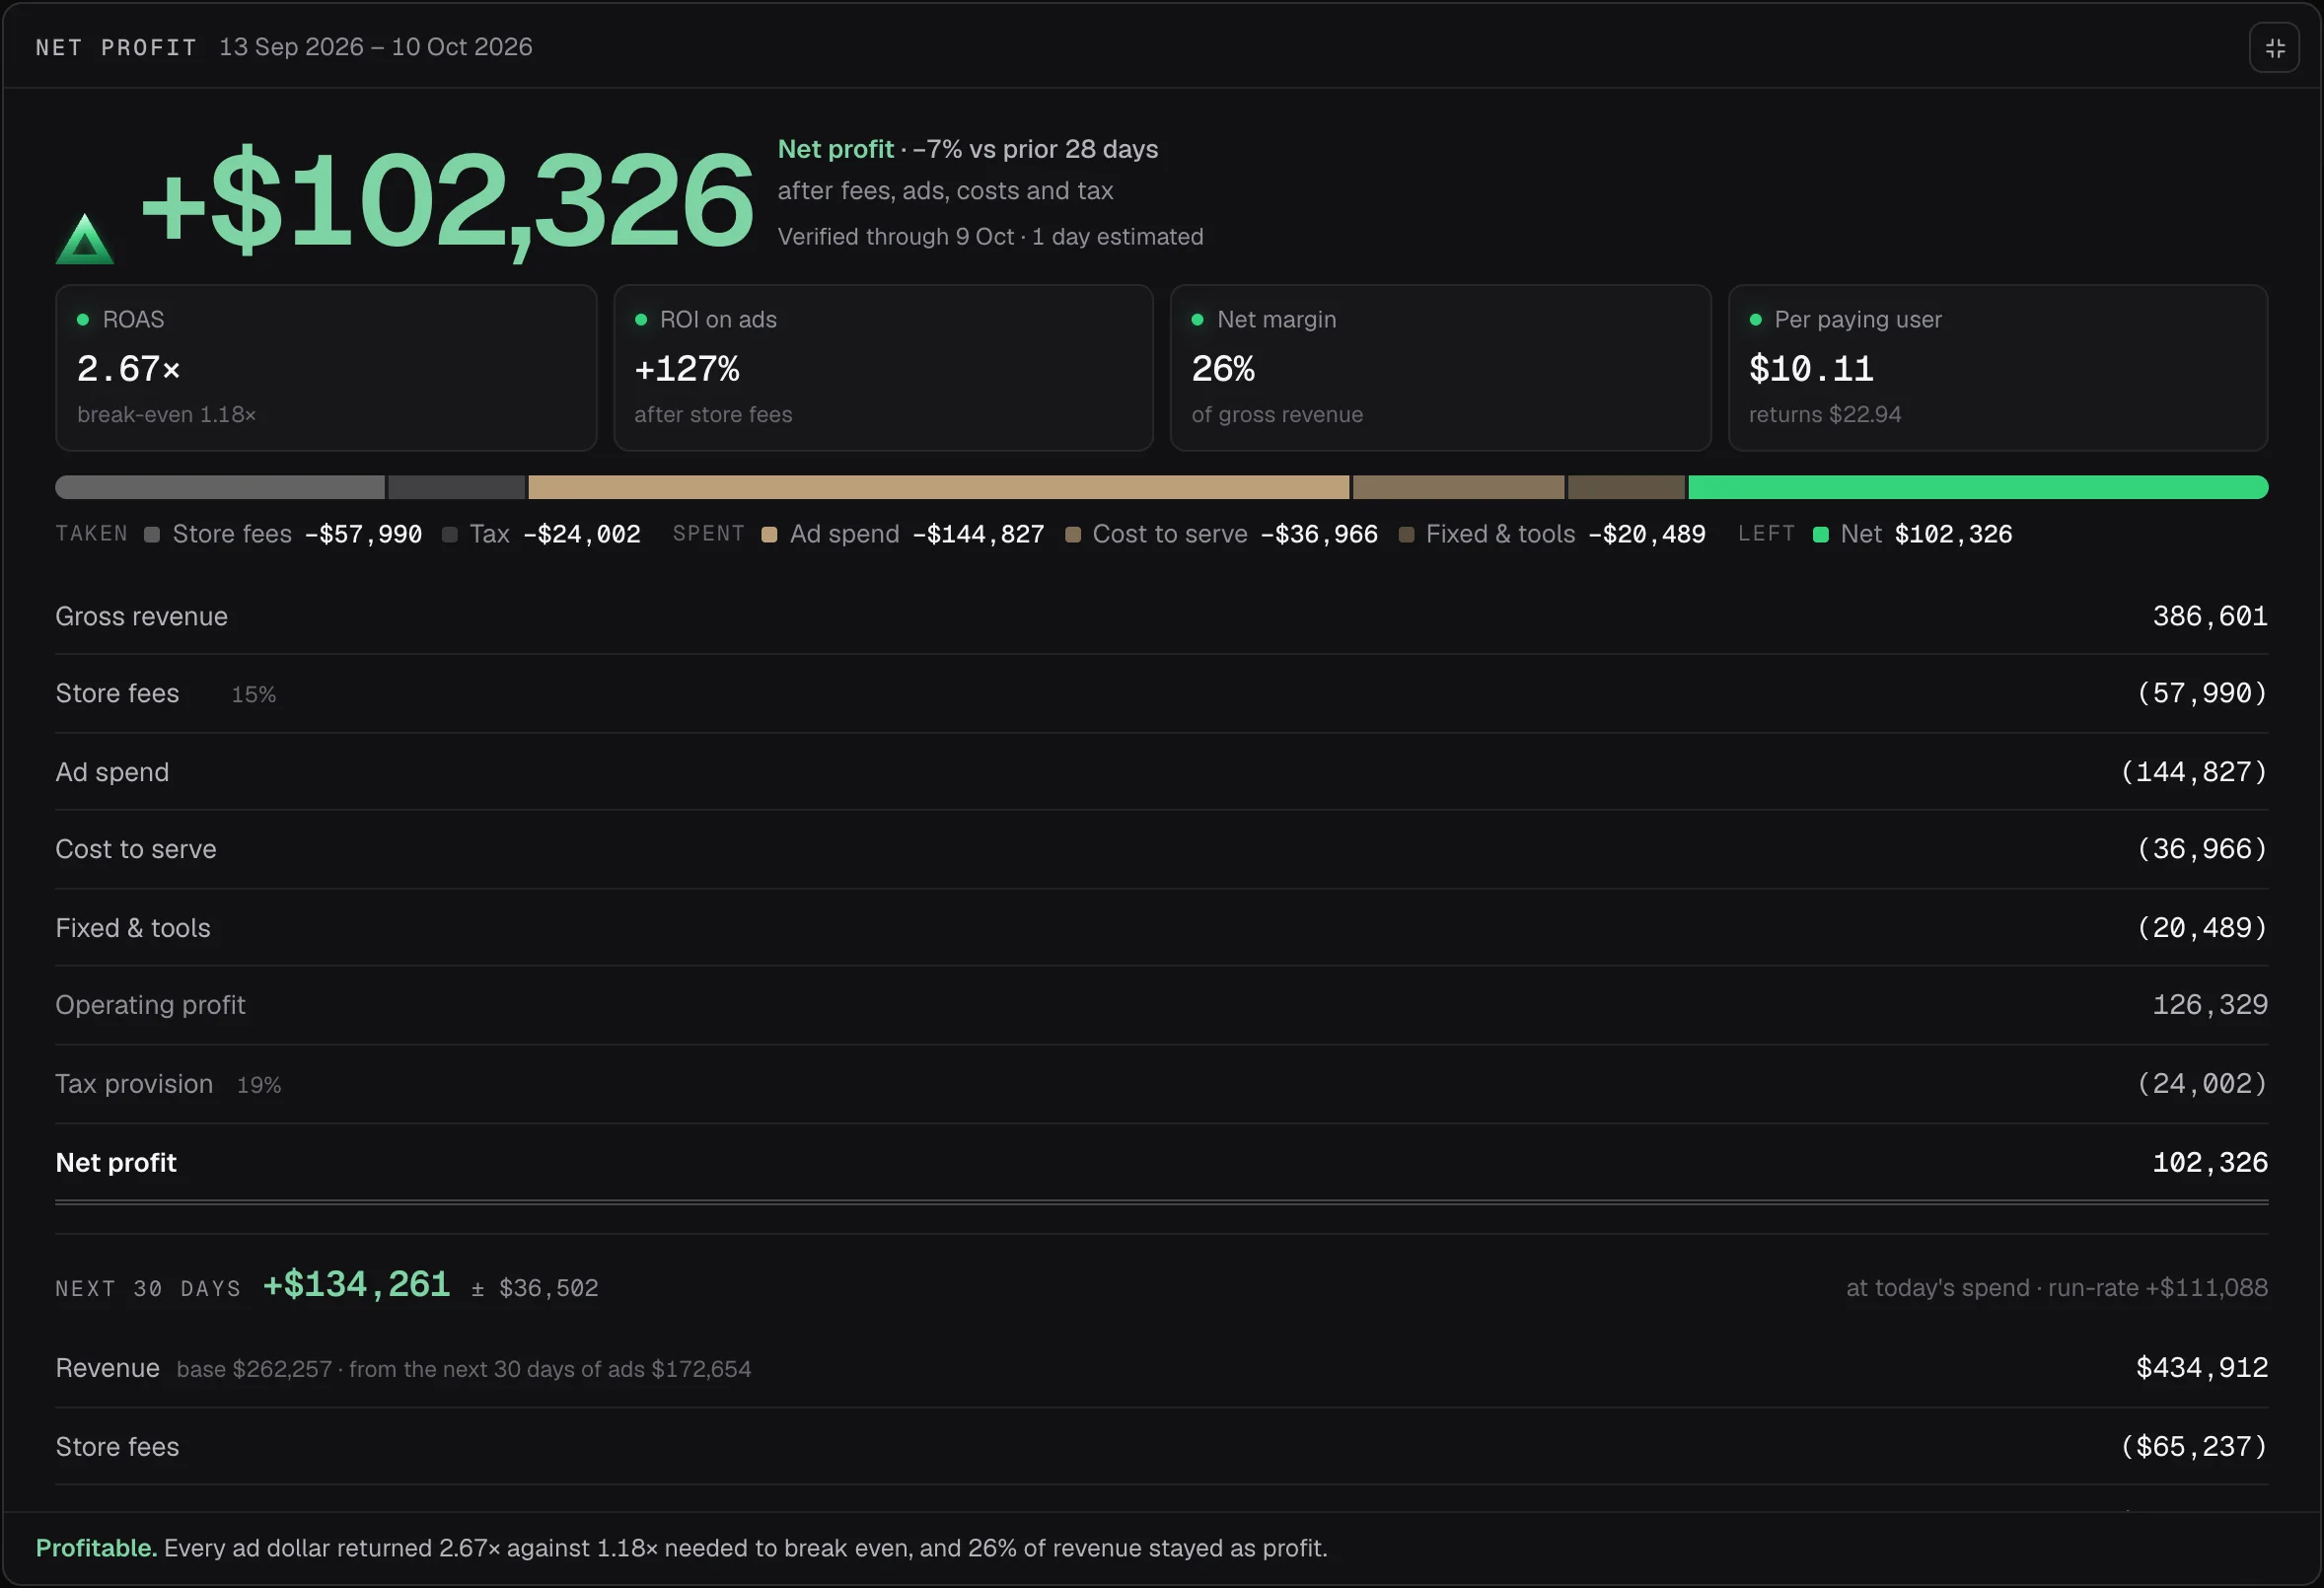
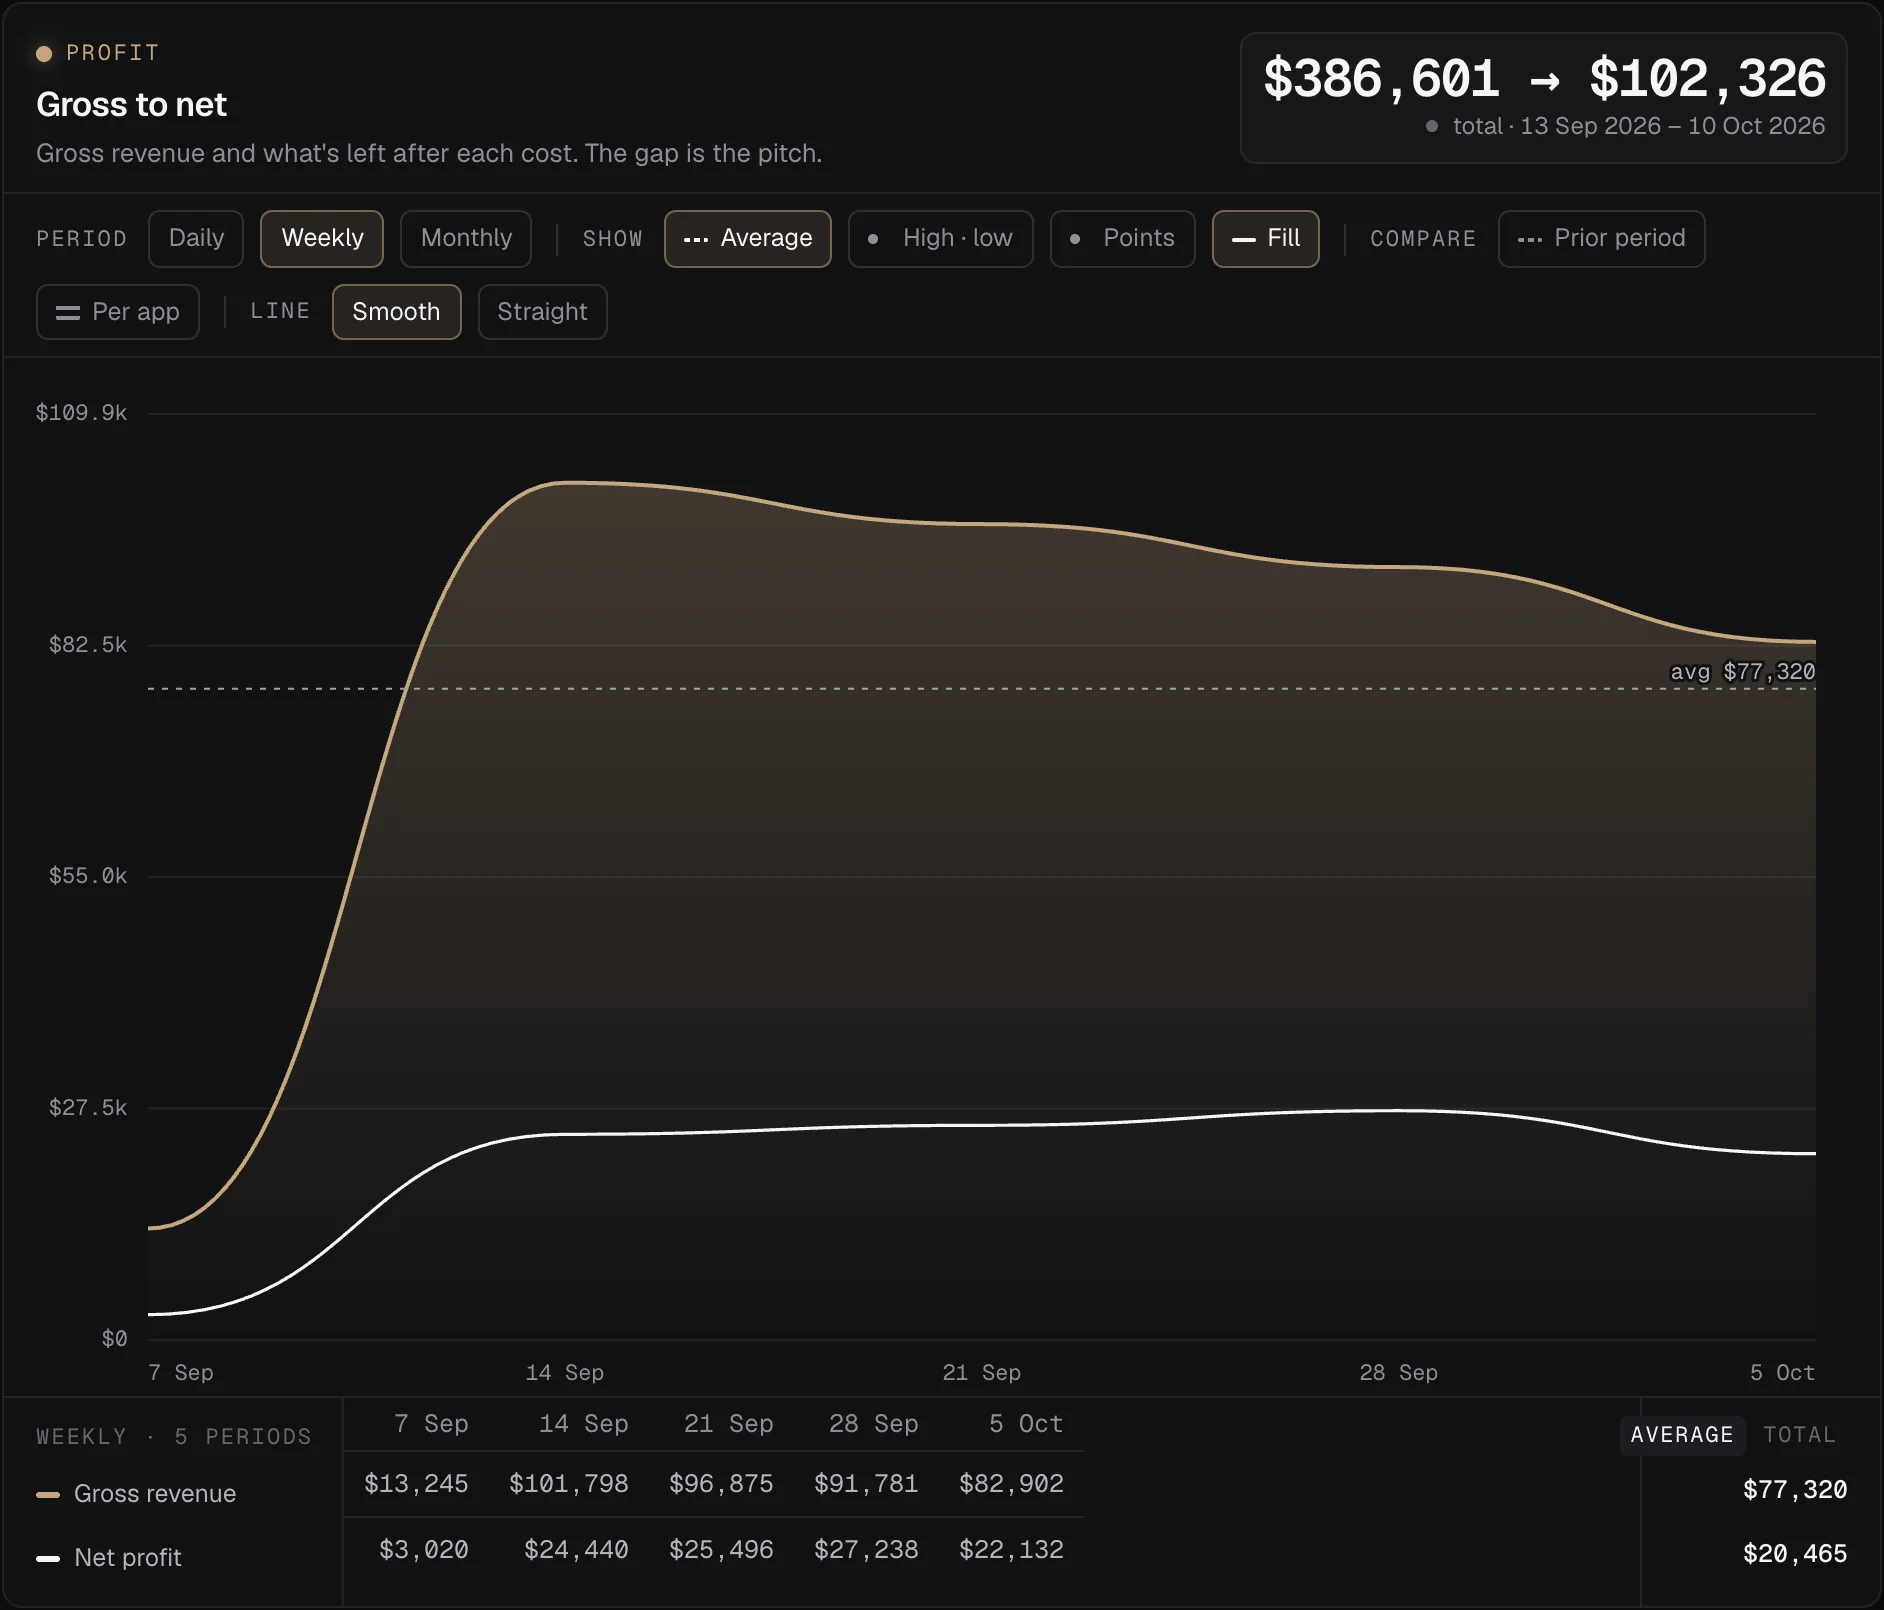
Fees, tax, ads, inference and people. One net number, every day.
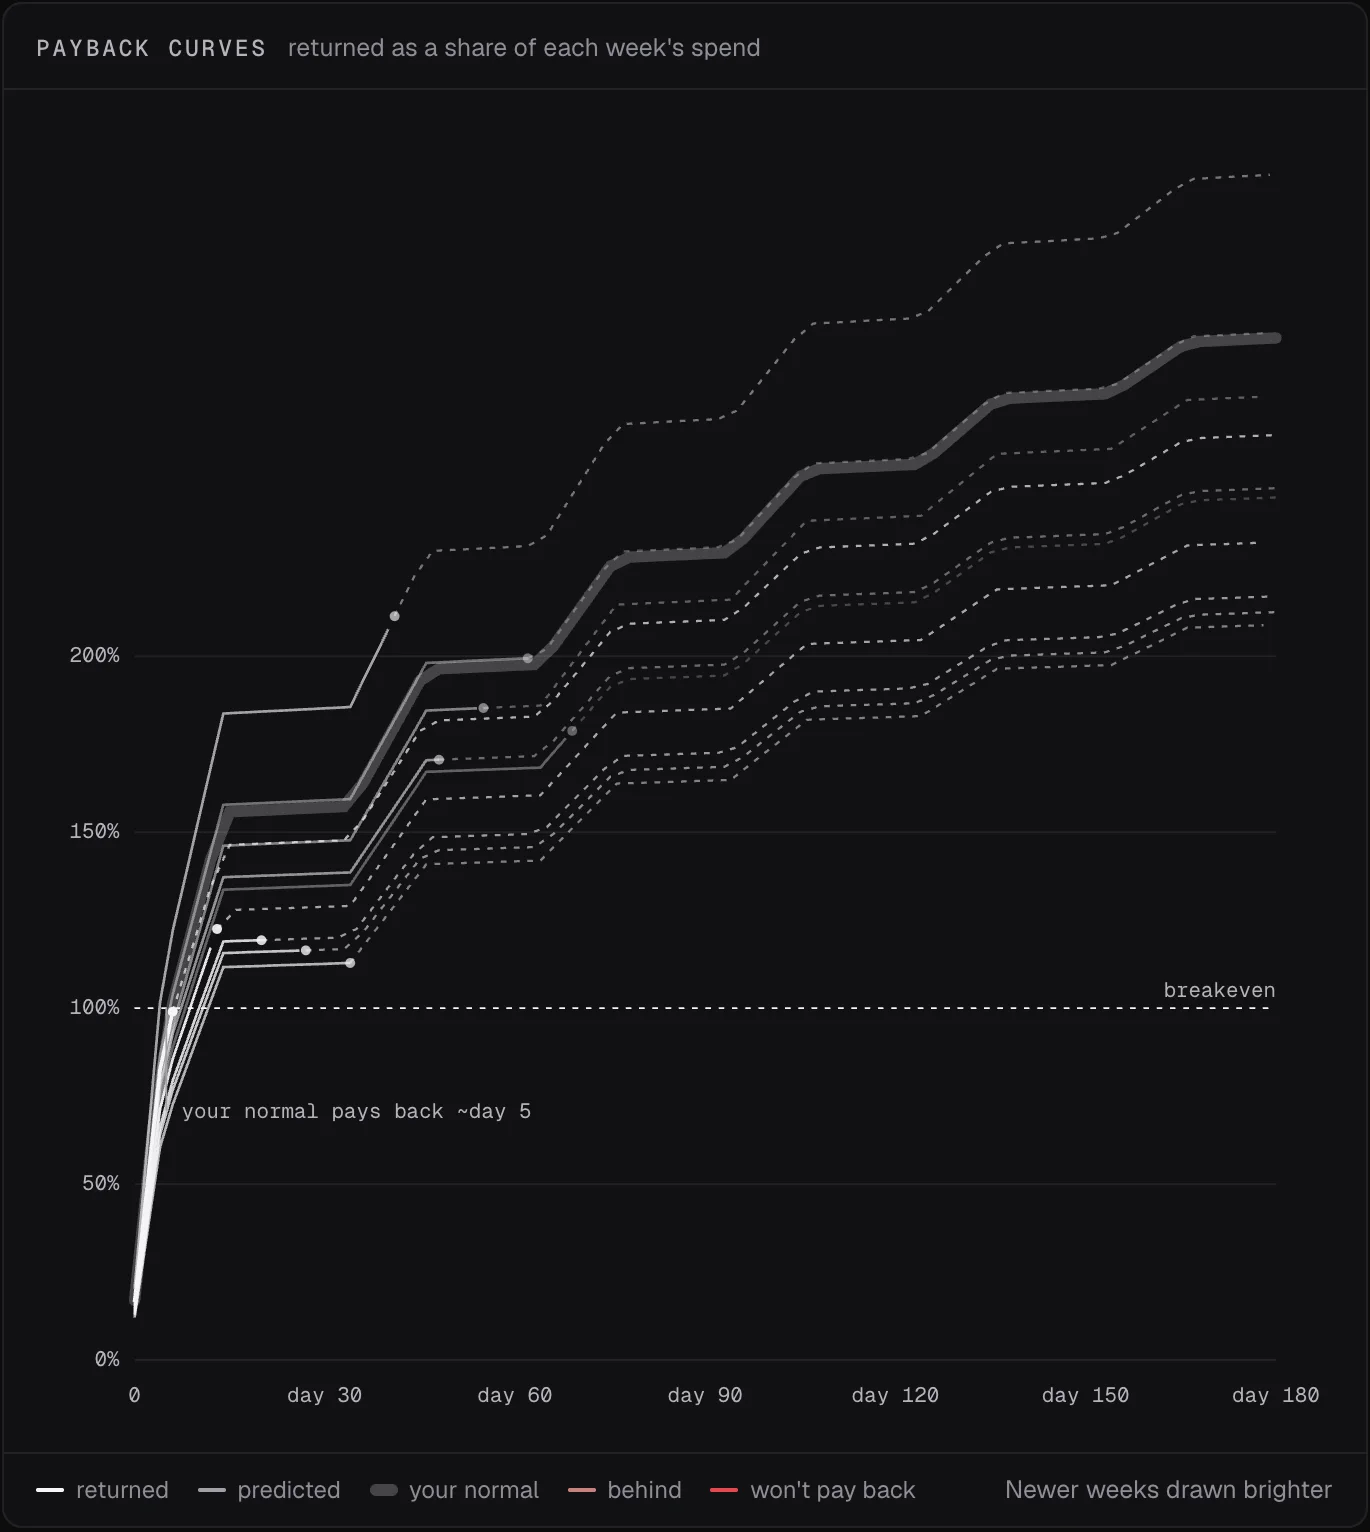
Two weeks in, the weeks of spend that won't pay back are flagged.
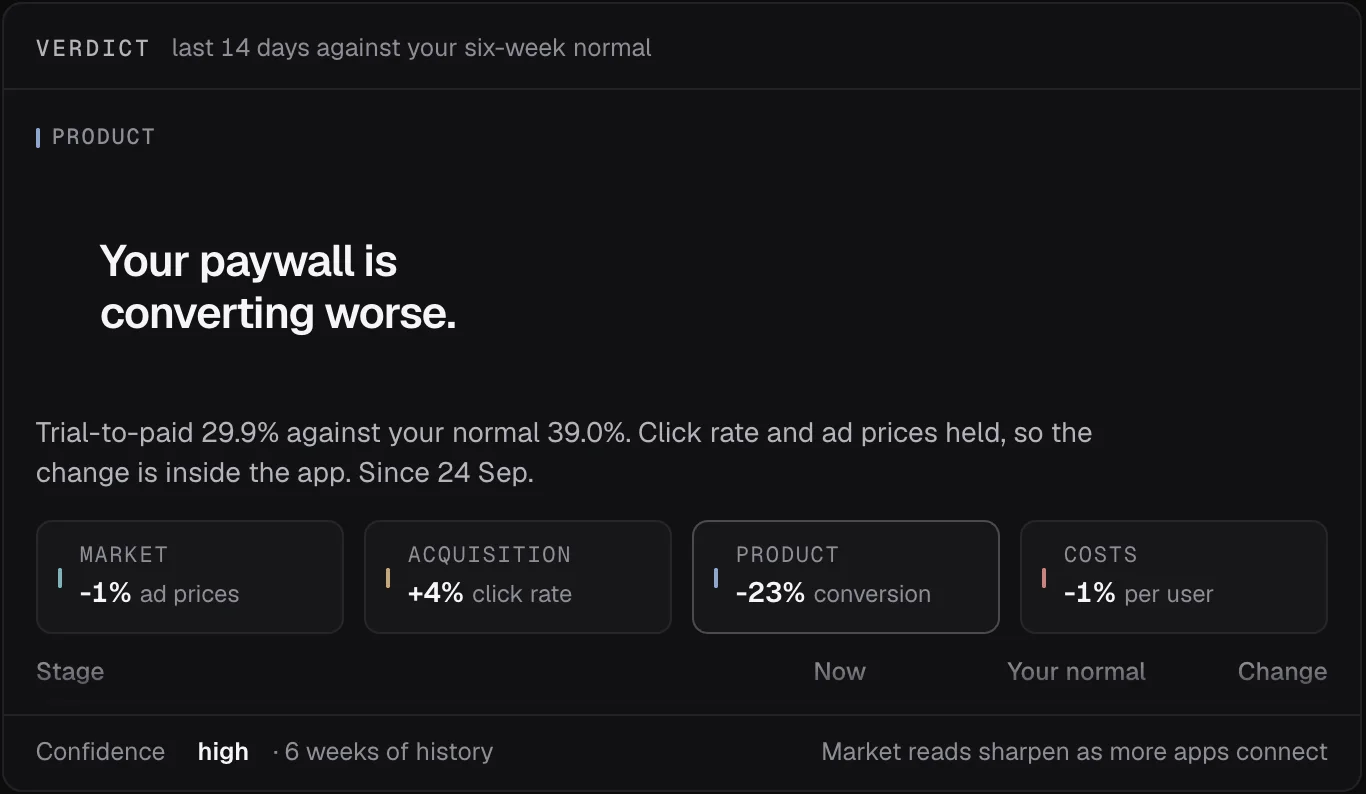
When a number moves, INTARC names the layer that moved it.
Read-only keys. No SDK. Up to three years of history on day one.
Up to 25 apps. Every feature. No card.
What you can't see today
It's split across six places: store fees, tax, ad invoices, inference, servers and people.
Then tax, ads and costs, in six places. The number you quote is not the number you keep.
$399,021 gross became $102,397 net in the demo. See the statement ›The rest comes in over the weeks and months after. INTARC follows it, week by week.
A normal week in the demo pays back on day 31. See the curves ›Market, ads, product or costs. Guess wrong and you rebuild the paywall when the auction got dearer.
In the demo, Wavelet's dip was the market, not the app. See the verdict ›The demo is a fictional studio whose every day carries ad spend, so its figures come from INTARC's model without its ads' share part, which learns from days without ads.
In ten seconds
What you keep. What's hiding. Why it moved, and what to do.
Store fees, ad spend, cost to serve, tools and tax, joined from six places. Net on every screen. The next 30 days land at $139,563, give or take $28,624.
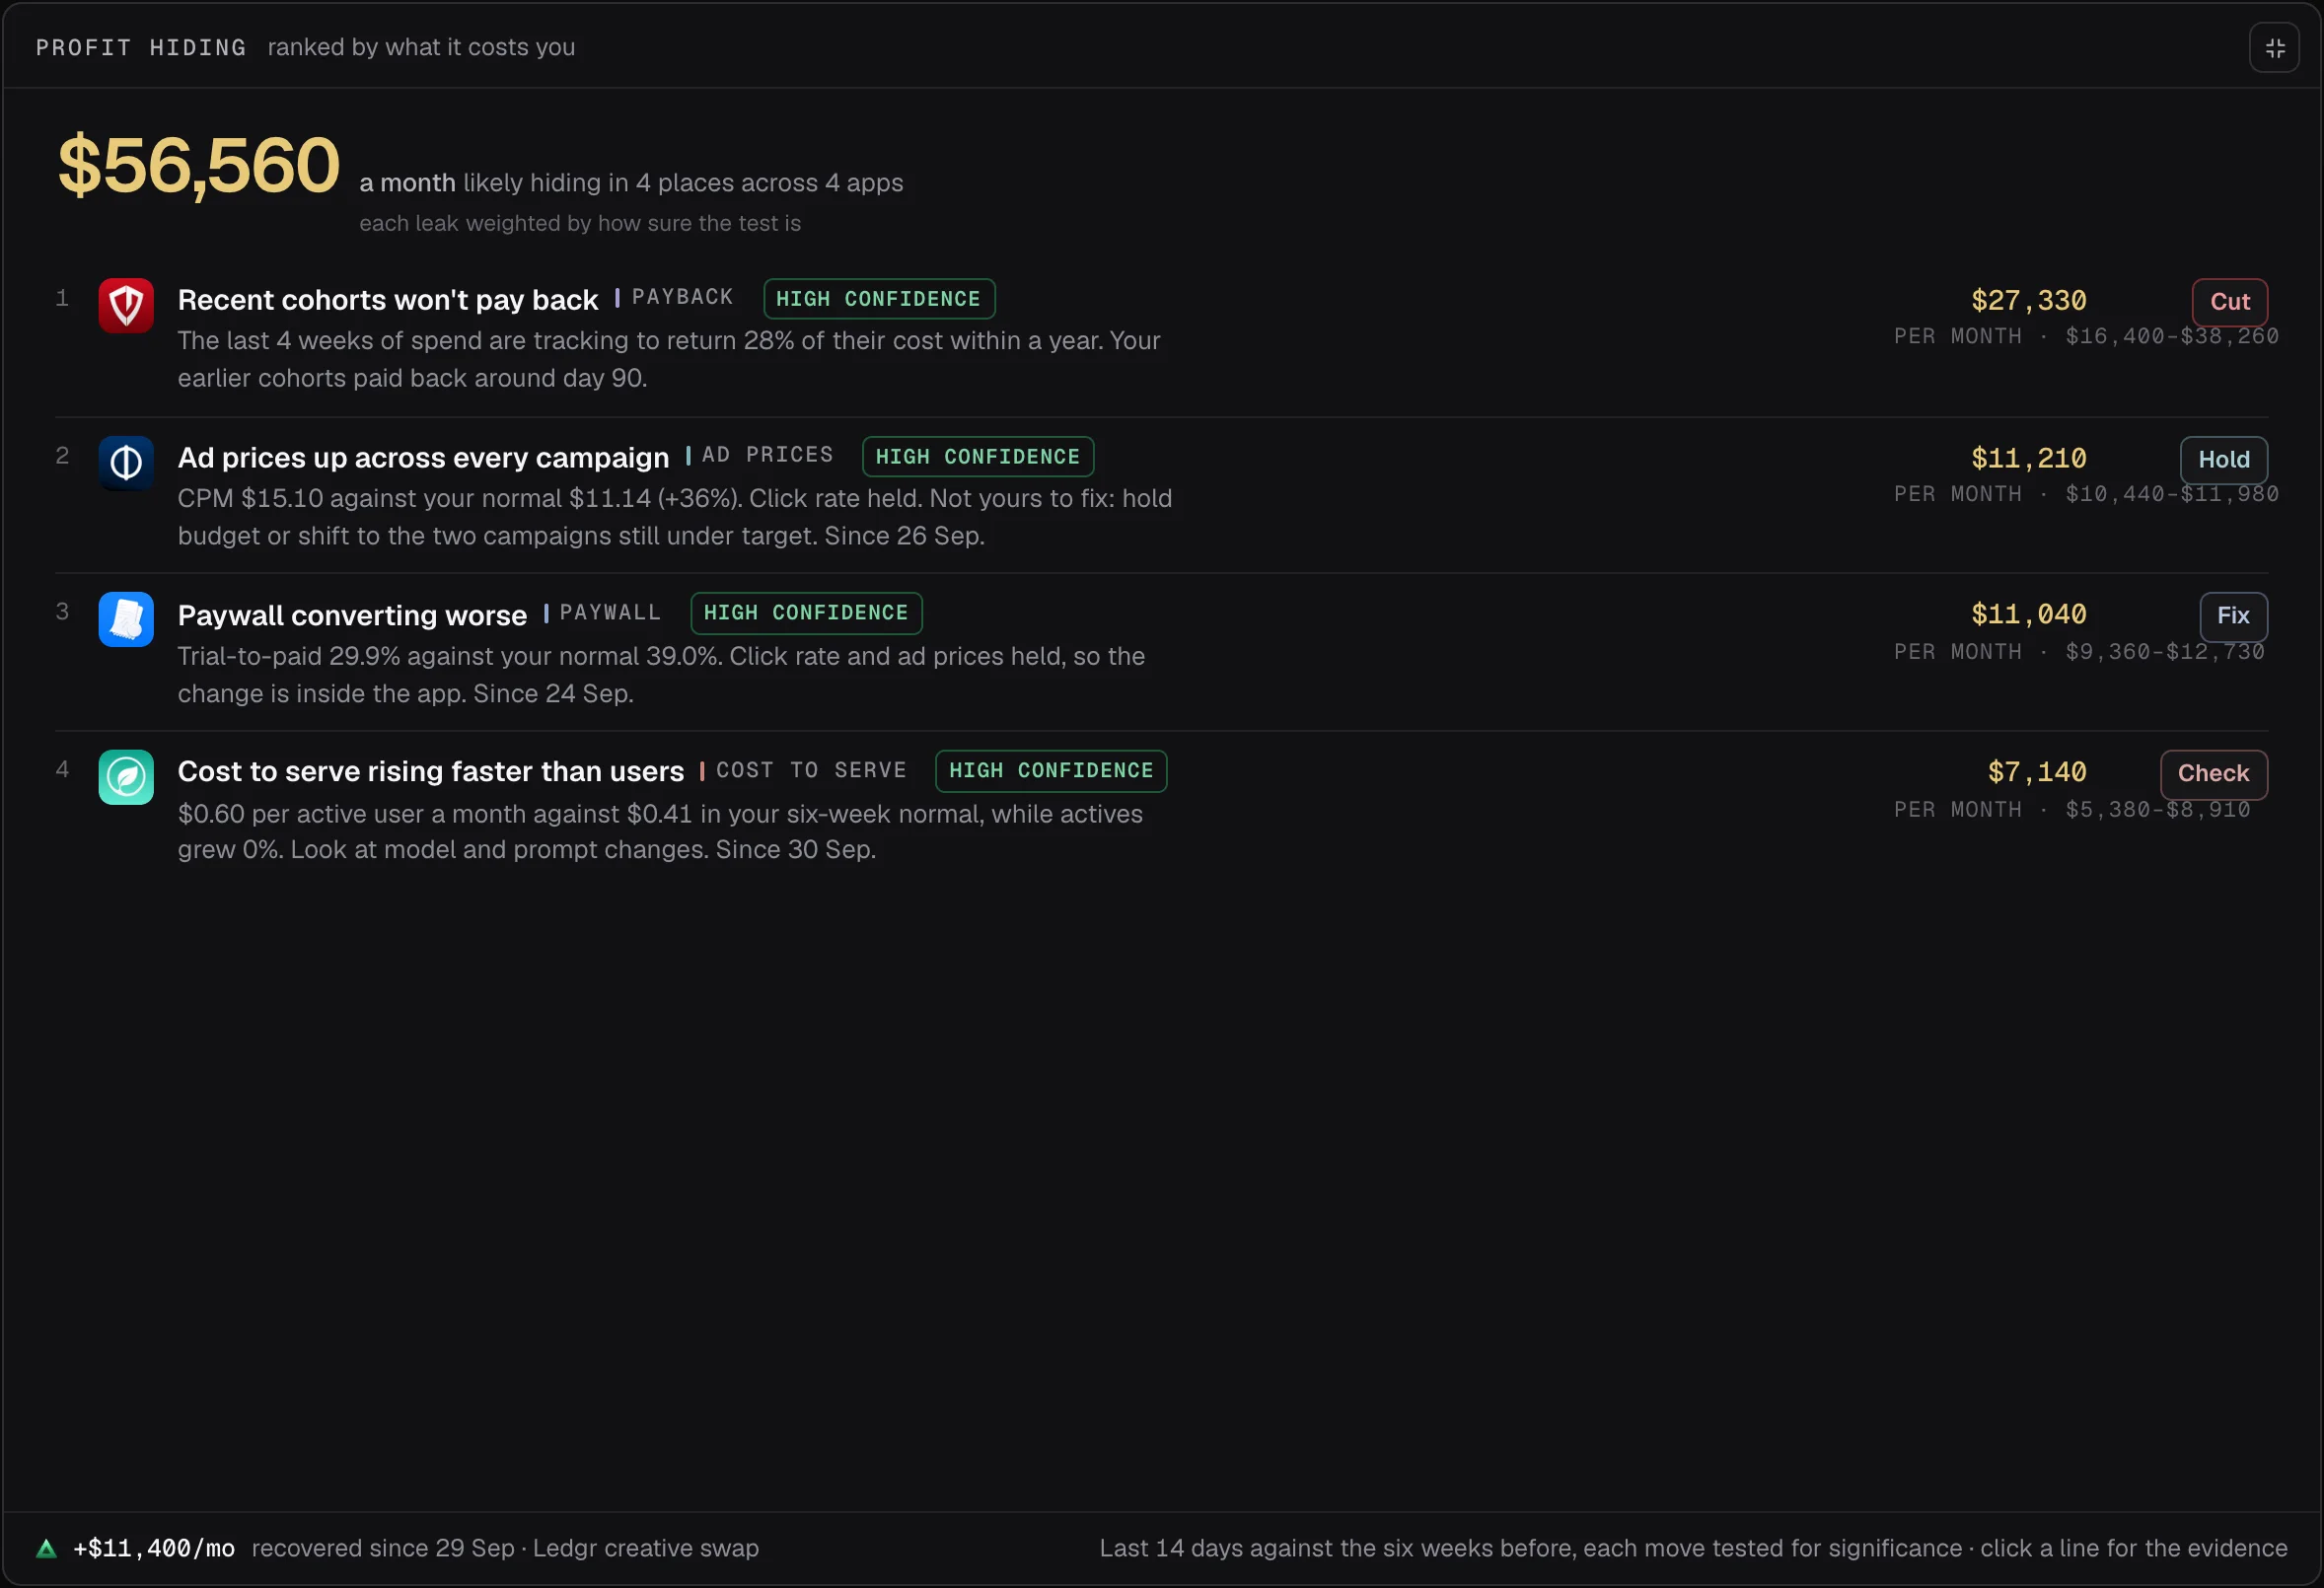
Each leak is sized against your own six-week normal and ranked by what it costs you, with a verdict you can act on.
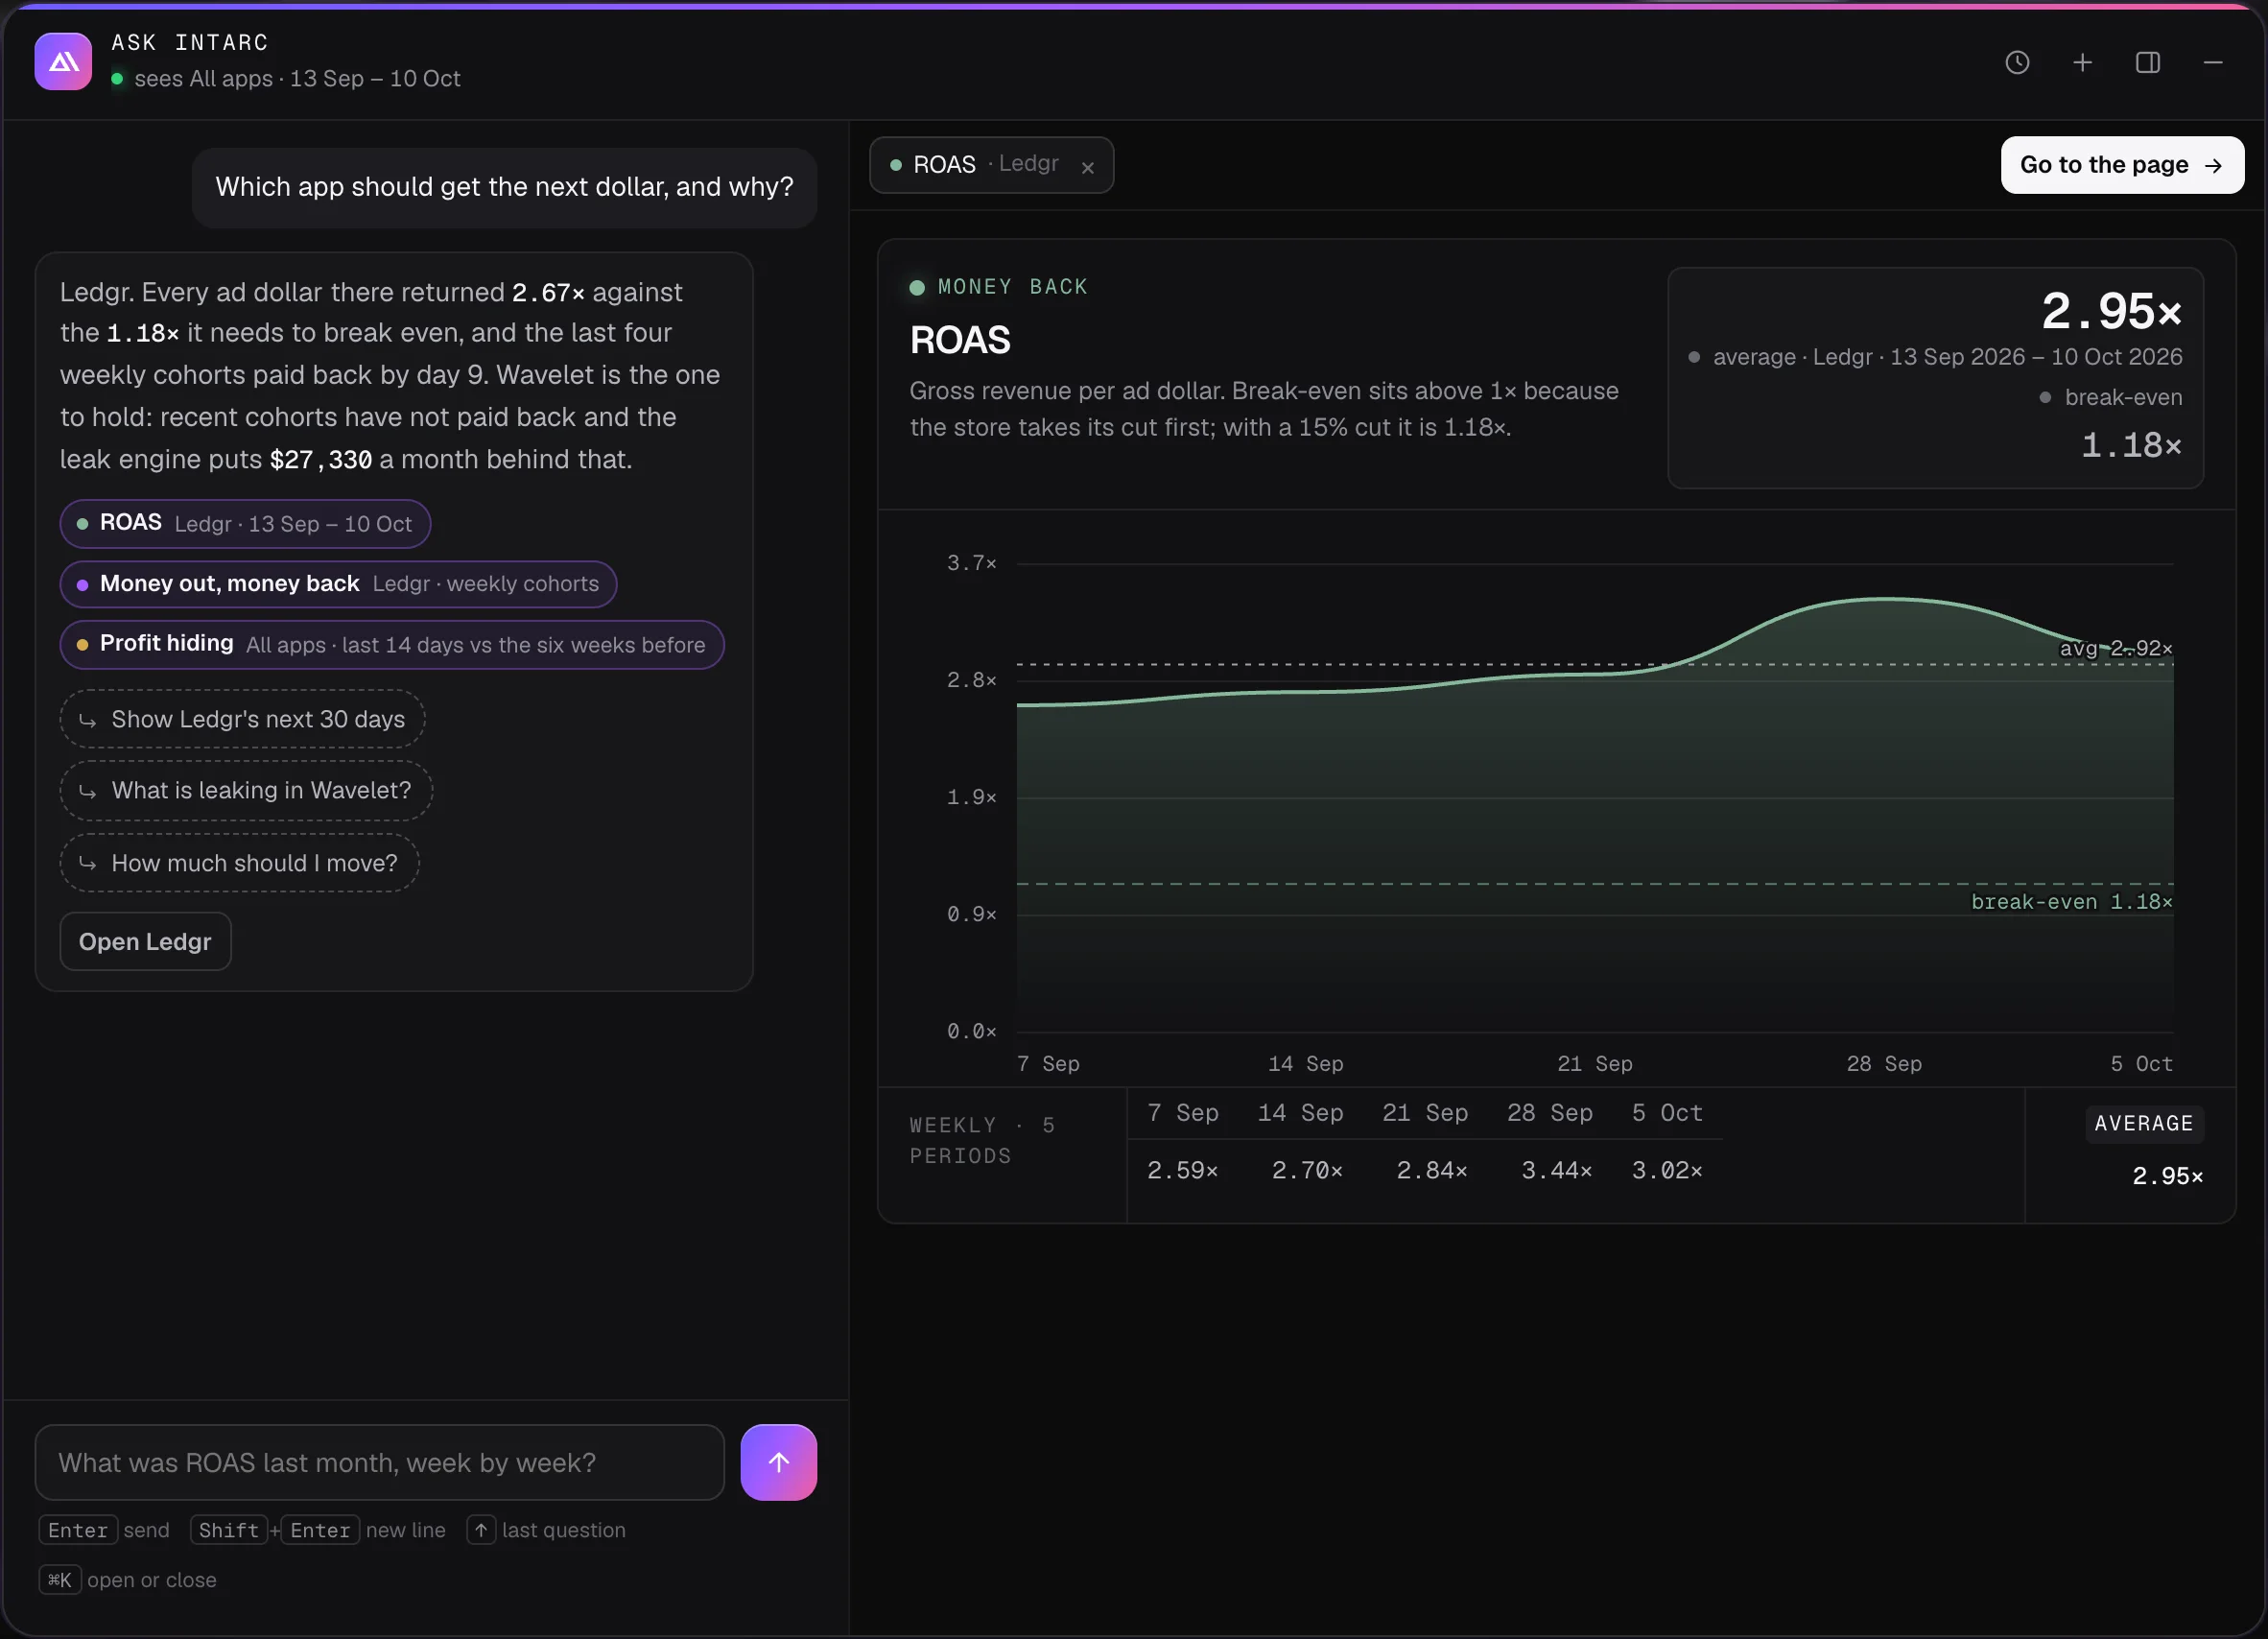
Ask in plain words. The analyst reads the exact figures behind every chart, answers in a few sentences, shows what it read, and flags any figure it cannot trace to it. Every stage is read against your normal. When one moves, INTARC names the layer, whether market, acquisition, product or costs, and the move that follows.
The demo is a fictional studio whose every day carries ad spend, so its figures come from INTARC's model without its ads' share part, which learns from days without ads.
Money out, money back
You pay for users today. They pay you back over months. INTARC follows the money to the week its users arrived and, about two weeks after each week of spend, makes a call: ahead, on track, behind or won't pay back.
Paused on a bad day-zero read. It would have paid back.
paid back · day 41The month looked fine; old subscribers carried it. The last four cohorts never pay back.
found out · months laterCalls you can check
INTARC replays your own history the day you connect, so you can see how its calls would have held. On its own studio, every call is scored in public.
Two weeks after a week of spend closes, INTARC calls it: ahead, on track, behind or won't pay back. Each call is scored on what that week's customers paid by day 90 and by a year.
What each week's new customers will pay by day 7, 30, 90, 180 and 365 is written down before it happens, then scored against what they paid. Every miss counts by its size in money.
The model is frozen, tagged in git and fingerprinted. Every forecast carries the fingerprint, and none can be changed once it is written.
Every forecast is written down the day it is made, before its truth exists, and scored when the truth arrives. The live record, a replay of the frozen model and the files to check every figure are public.
Real profit
Fees from proceeds. Tax at your rate. Ad spend from the accounts. Every other cost as a rule. Profit is always net.
15% or 30%, from RevenueCat proceeds. Per app.
Inference, storage, messaging. Connected, or entered as a rate.
People and servers you share across apps, split however you say.
Costs are predictable, so the forecast is honest: a number and a range.
The why
Every stage and every cost line is read against your own six-week normal. Leaks are sized in money, ranked, and given a verdict you can act on.
Ad prices rose in every campaign at once. Everything downstream held.
It's the market, not you.
Prices held, click rate fell. The users you buy got worse, not dearer.
Rotate creative. Don't touch targeting.
Same users, same prices, worse conversion at the trial, the paywall or the purchase.
Trial-to-paid 10 points down since 24 Sep.
Cost per active user rose while revenue per user stayed flat.
Inference per user up 58%. Diff the prompt.
The analyst
Not a dashboard you interpret. A model that learns what normal looks like for each of your apps, tests every move against it, and hands you a verdict with the money behind it.
Six weeks of your own history become the baseline for each app: prices, click rates, conversion, costs. Nothing is judged against someone else's average.
per appFour layers, market, acquisition, product and costs, each move tested for significance before it is called a leak. A verdict names the layer, the money per month and the fix.
every syncApprove a move and it is forecast, then measured for fourteen days against the fourteen before. Each outcome sharpens the next forecast for your own apps. The plan, opt-in and off by default: INTARC will get smarter with every app that opts in.
14 daysAsk it anything in plain words. The analyst reads the exact figures behind every chart, any app, any period, answers in a few sentences, shows what it read, and flags any figure it cannot trace to it.
Connecting
No SDK, no code change. Paste read-only keys you already have. INTARC reads the last 180 days first, so the dashboard is ready in minutes, and up to three years of history on day one. It learns your normal. Revenue refreshes every 10 minutes.
Paste a RevenueCat secret key. Subscriptions, consumables and non-consumables alike. Or App Store Connect and Google Play directly, one for each store, and AdMob for the ads your app shows.
read-only keyA Meta token or an Apple Search Ads key; TikTok is in review. Spend, clicks and installs, by campaign, by day.
read-only tokenYour taxes once, proposed for your country. Fixed costs as rules. Per-user costs as a rate, or connect OpenAI usage.
entered once| RevenueCat | revenue · trials · conversions | synced 06:00 |
| App Store Connect | downloads · proceeds | synced 03:15 |
| Google Play | installs · proceeds | synced 03:15 |
| AdMob | ad revenue · impressions | not connected |
| Meta Ads | spend · impressions · clicks · installs | synced 06:00 |
| TikTok Ads | spend · installs | in review |
Pricing
Connect your apps, read your real profit, and tell us what's missing. We'll tell you the price before your free period ends.
No code? Register and request one.
Read-only keys. Nothing is ever written to your accounts. Delete everything in one click.
About 15 minutes from now
Read-only keys · nothing is ever written to your accounts · delete everything in one click
Know what you keep.